
Newport’s Clean Water Journey: From Combined Sewer Overflow to Integration
The Water Pollution Control Division (WPC) has led a multi-phase, long-term effort to reduce combined sewer overflows (CSOs) and protect the water quality of Newport Harbor since the 1970s. Major capital obligations under the original CSO Long Term Control Plan have been substantially completed, while ongoing compliance, optimization, reporting, and integrated planning obligations continue under the active Consent Decree. WPC has shifted focus to an integrated approach that addresses CSO obligations alongside stormwater quality, flood mitigation, and climate resilience.
Related Reports and Resources
Rate restructuring is under public review
A rate study is under public review. No change has been adopted.
The existing CSO Annual Fixed Fee is proposed to transition into a sewer base charge tied to meter size as part of the broader wastewater rate restructuring through an ordinance amendment at the same Council action that adopts the new sewer rate structure. Total cost recovery is preserved dollar-for-dollar at adoption; the line item is restructured to reflect the broader operational and capital cost basis of the sewer system. Revenue supporting CSO Long Term Control Plan obligations under the federal Consent Decree remains dedicated to that purpose.
Overview
WPC’s CSO Control Program is part of a long-term System Master Plan under a Consent Decree with EPA and RIDEM. The goal is to reduce combined sewer overflow events through infrastructure upgrades, separation of stormwater and wastewater pipes, and long term planning. Major capital obligations under the original CSO Long Term Control Plan have been substantially completed, while ongoing compliance, optimization, reporting, and integrated planning obligations continue under the active Consent Decree.
Read more…
Newport’s sewer system, originally built in the 1870s, was designed as a single-pipe system that carried both stormwater and sanitary wastewater. Since the 1970s, WPC has been separating stormwater and wastewater pipes to reduce the occurrence of combined sewer overflows. Today, Newport’s system contains both separate and combined components. During heavy rain events, combined components can become overwhelmed, which may trigger a combined sewer overflow event.
When this happens, excess flow is conveyed to one of the City’s two permitted CSO facilities for treatment and disinfection before discharge to the harbor:
- Wellington Avenue CSO Treatment Facility (constructed 1978)
- Washington Street CSO Treatment Facility (constructed 1991)
A New Chapter in Protecting the Harbor and Community
Major capital obligations under the original CSO Long Term Control Plan have been substantially completed, while ongoing compliance, optimization, reporting, and integrated planning obligations continue under the active Consent Decree. Every permitted CSO discharge passes through one of the City’s two treatment facilities before reaching the harbor. Stormwater runoff, rather than CSO discharges, is now the primary water quality challenge in receiving waters, as shown in the enterococci summary below.
WPC is now applying an integrated approach to water management that addresses CSO compliance, stormwater pollution control, flood mitigation, and climate resilience as connected challenges rather than separate programs.
Where We Are Now
An Integrated Approach to Water Management
What Integrated Planning Includes
WPC’s Integrated Water Quality and Resilience Strategy combines:
- CSO compliance
- Stormwater (MS4) pollution control
- Flood mitigation and green infrastructure
- Climate adaptation
- Affordable, community-centered investments
This approach aligns with the EPA’s Integrated Municipal Planning Framework, which allows municipalities to address multiple Clean Water Act obligations under a single coordinated strategy rather than as separate competing programs.
Why Integration Matters
What WPC Has Achieved
Over the last 20 years, the CSO Program has delivered:
Annual Enterococci Exceedance Summary for Harbor Waters
| Year | Total Samples Collected | Total Enterococci Exceedances | Exceedances Associated with Rainfall (No CSO Event) | Exceedances Preceded by 24+ Hours of Dry Weather | Exceedances 0-2 Days After a CSO Event |
|---|---|---|---|---|---|
| 2019 | 500 | 5 | 2 | 1 | 2 |
| 2020 | 520 | 6 | 3 | 3 | 0 |
| 2021 | 520 | 0 | 0 | 0 | 0 |
| 2022 | 510 | 1 | 1 | 0 | 0 |
| 2023 | 500 | 2 | 1 | 0 | 1 |
| 2024 | 540 | 9 | 8 | 1 | 0 |
| Total | 3,090 | 23 | 15 | 5 | 3 |
Total Samples Collected: 500
Total Enterococci Exceedances: 5
Exceedances Associated with Rainfall (No CSO Event): 2
Exceedances Preceded by 24+ Hours of Dry Weather: 1
Exceedances 0-2 Days After a CSO Event: 2
Total Samples Collected: 520
Total Enterococci Exceedances: 6
Exceedances Associated with Rainfall (No CSO Event): 3
Exceedances Preceded by 24+ Hours of Dry Weather: 3
Exceedances 0-2 Days After a CSO Event: 0
Total Samples Collected: 520
Total Enterococci Exceedances: 0
Exceedances Associated with Rainfall (No CSO Event): 0
Exceedances Preceded by 24+ Hours of Dry Weather: 0
Exceedances 0-2 Days After a CSO Event: 0
Total Samples Collected: 510
Total Enterococci Exceedances: 1
Exceedances Associated with Rainfall (No CSO Event): 1
Exceedances Preceded by 24+ Hours of Dry Weather: 0
Exceedances 0-2 Days After a CSO Event: 0
Total Samples Collected: 500
Total Enterococci Exceedances: 2
Exceedances Associated with Rainfall (No CSO Event): 1
Exceedances Preceded by 24+ Hours of Dry Weather: 0
Exceedances 0-2 Days After a CSO Event: 1
Total Samples Collected: 540
Total Enterococci Exceedances: 9
Exceedances Associated with Rainfall (No CSO Event): 8
Exceedances Preceded by 24+ Hours of Dry Weather: 1
Exceedances 0-2 Days After a CSO Event: 0
Total Samples Collected: 3,090
Total Enterococci Exceedances: 23
Exceedances Associated with Rainfall (No CSO Event): 15
Exceedances Preceded by 24+ Hours of Dry Weather: 5
Exceedances 0-2 Days After a CSO Event: 3
From Projects to Progress: Why the Shift Matters
- CSOs were once the leading water quality issue in Newport Harbor; they are no longer.
- Overflows can still occur during extreme weather. Treated discharges are reported under permit and, as shown in the enterococci summary above, contribute to a small minority of harbor bacteria exceedances.
- Stormwater runoff from streets and neighborhoods is now the leading cause of harbor pollution.
- Climate-driven rainfall intensity and aging stormwater infrastructure are increasing complexity.
The Department’s strategy reflects this shift, addressing water quality, flooding, and resilience as connected challenges that benefit from coordinated capital investment.
Real-Time Newport Harbor Data
Two monitoring stations in Newport Harbor collect ambient water quality data year-round.
The Department of Utilities operates two continuous water quality monitoring stations in Newport Harbor. These stations measure ambient conditions in the receiving water and support transparency about harbor water quality over time, including how it varies with weather, tides, and seasonal activity. Together with compliance sampling required under the City’s RIPDES discharge permits, these stations provide continuous awareness of the waters that receive treated effluent and CSO discharge.
Newport Harbor Monitoring Station 1
Newport Harbor. Continuous ambient water quality monitoring.
Newport Harbor Monitoring Station 2
Newport Harbor. Continuous ambient water quality monitoring.
How to read the data
- These stations measure ambient harbor conditions, not regulatory compliance. Harbor water reflects many inputs including runoff, upstream rivers, tidal exchange with the bay, boating activity, and wildlife. The data provides a continuous picture of conditions but is not used for RIPDES compliance. Compliance sampling is conducted through the City’s RIPDES permit program and reported to RIDEM.
- Conditions vary with weather and tides. Salinity changes with freshwater input during storms. Dissolved oxygen varies with temperature and biological activity. Turbidity increases after heavy rain when runoff enters the harbor. These patterns are normal and expected.
- Elevated readings during or after storms are expected. Heavy rainfall increases runoff carrying sediment, nutrients, and other pollutants from land surfaces across the entire watershed. As shown in the enterococci data above, rainfall-associated exceedances now outnumber CSO-associated exceedances, which is why stormwater source control and the MS4 program are important.
- Year-round operation. The harbor stations operate continuously, year-round, providing uninterrupted data except during scheduled maintenance or calibration.
Data hosted by NexSens WQData LIVE. The Department of Utilities is responsible for the monitoring stations and their maintenance. For the consolidated view of all Department monitoring stations, see the Water Quality Monitoring page. For questions about stormwater or wastewater discharge monitoring, contact the Department at 401-845-5600 or see the Wastewater Quality and Performance page for discharge monitoring data.
What is Coming Next
From Overflow to Integration
Newport’s CSO program transformed Narragansett Bay water quality over two decades. The next phase of WPC’s work focuses on resilience, clean water, and continued investment in the integrated infrastructure that supports both.
CSO Discharge Volume Trends Since 2001
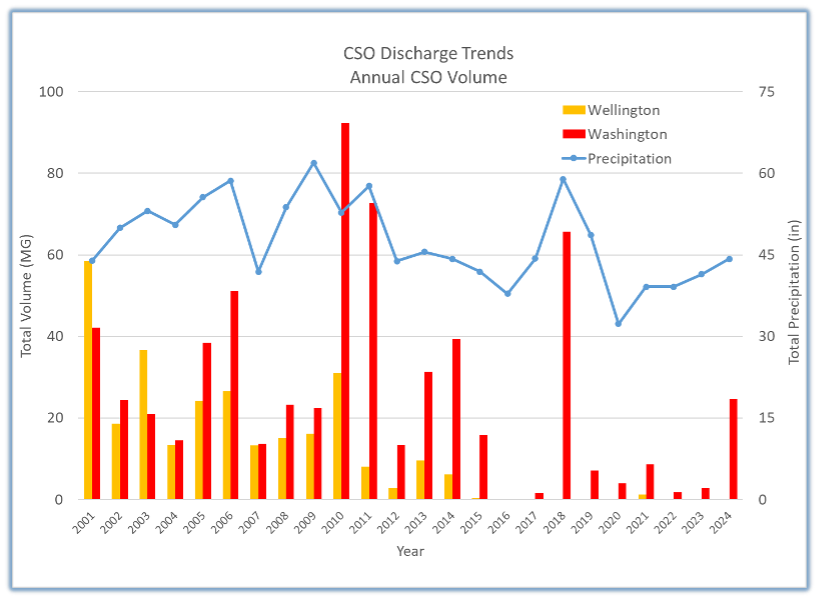
| Period | Approximate Annual CSO Discharge Volume |
|---|---|
| Early 2000s baseline | [VERIFY: approximately 40 to 45 million gallons annually] |
| Mid 2000s | [VERIFY: declining as CSO LTCP projects came online] |
| 2010s | [VERIFY: continued decline] |
| 2020s | [VERIFY: more than 80 percent reduction from baseline, approximately 35 million gallons annually reduced] |
CSO Discharge Frequency Trends Since 2001
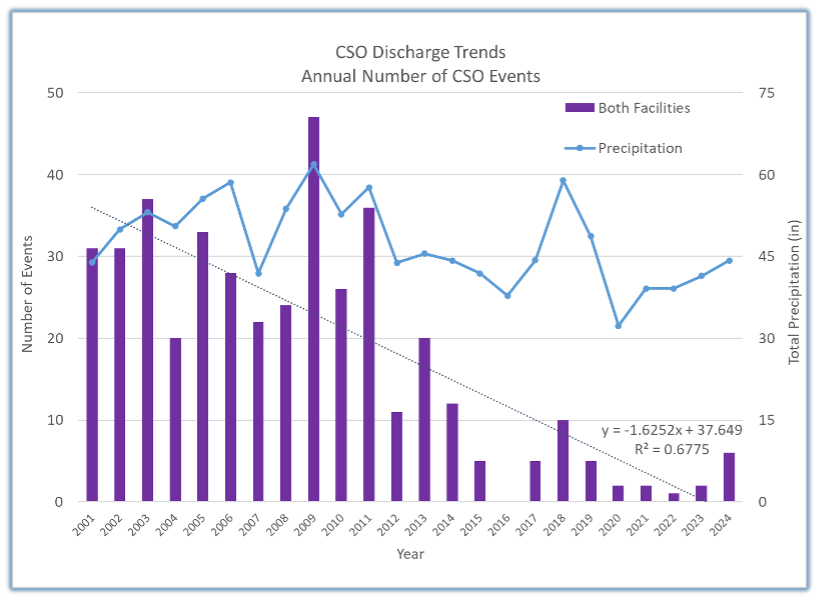
| Period | Approximate Annual CSO Event Count |
|---|---|
| Early 2000s baseline | [VERIFY: annual event count at baseline] |
| Mid 2000s | [VERIFY: declining frequency] |
| 2010s | [VERIFY: further reduction] |
| 2020s | [VERIFY: events occur during heavy rain only; specific count by year] |