
Calendar Year 2024 Data. This page summarizes Newport Water Pollution Control Facility performance for January through December 2024. Calendar Year 2025 data will be posted in 2026 following final laboratory data reconciliation and annual report preparation.
Newport’s wastewater treatment plant treated more than 3.4 billion gallons in 2024 and operated within RIPDES permit terms. The plant achieved approximately 91 percent removal of organic pollution (BOD) and 90 percent removal of suspended solids (TSS). Three isolated daily exceedance events occurred during the year, all promptly addressed through equipment repairs or process corrections and reported to RIDEM in accordance with the permit. The April CSO event resulted in a TSS removal of 46.7 percent, below the 50 percent permit minimum for that event; this was reported to RIDEM as required.
Plant operations and laboratory monitoring are performed by Veolia Water Services Newport LLC under a 20 year contract with the Department of Utilities, in effect since July 2016. Compliance reporting is filed with RIDEM under the City’s RIPDES discharge permit.
Regulatory Framework
The Water Pollution Control Facility operates under the Federal Clean Water Act and the Rhode Island Pollutant Discharge Elimination System (RIPDES) discharge permit administered by RIDEM. The City operates under a long standing federal Consent Decree with EPA and RIDEM that addresses combined sewer overflow control. All effluent monitoring, exceedance reporting, and corrective actions are conducted in accordance with RIPDES permit conditions and reported to RIDEM through monthly Discharge Monitoring Reports.
What We Measure
2024 Performance Summary
| Category | Result |
|---|---|
| Organic pollution (BOD) removal | 91.5 percent |
| Suspended solids (TSS) removal | 90.4 percent |
| pH | 6.9 to 7.1 SU |
| Fecal coliform | Less than 25 MPN per 100 mL (12 month compliant) |
| Total flow treated | Approximately 3.4 billion gallons |
| Effluent quality | BOD and TSS less than 20 mg/L for 10 of 12 months |
| Wet weather flow management | Peak 15.4 MGD handled within permit terms |
| Disinfection | All bacteria metrics within permit limits |
| Process variance | Three isolated daily exceedance events; all reported to RIDEM and corrected |
| CSO operations | All events disinfected and reported per permit |
Result: 91.5 percent
Result: 90.4 percent
Result: 6.9 to 7.1 SU
Result: Less than 25 MPN per 100 mL (12 month compliant)
Result: Approximately 3.4 billion gallons
Result: BOD and TSS less than 20 mg/L for 10 of 12 months
Result: Peak 15.4 MGD handled within permit terms
Result: All bacteria metrics within permit limits
Result: Three isolated daily exceedance events; all reported to RIDEM and corrected
Result: All events disinfected and reported per permit
Storm Impacts and Maintenance
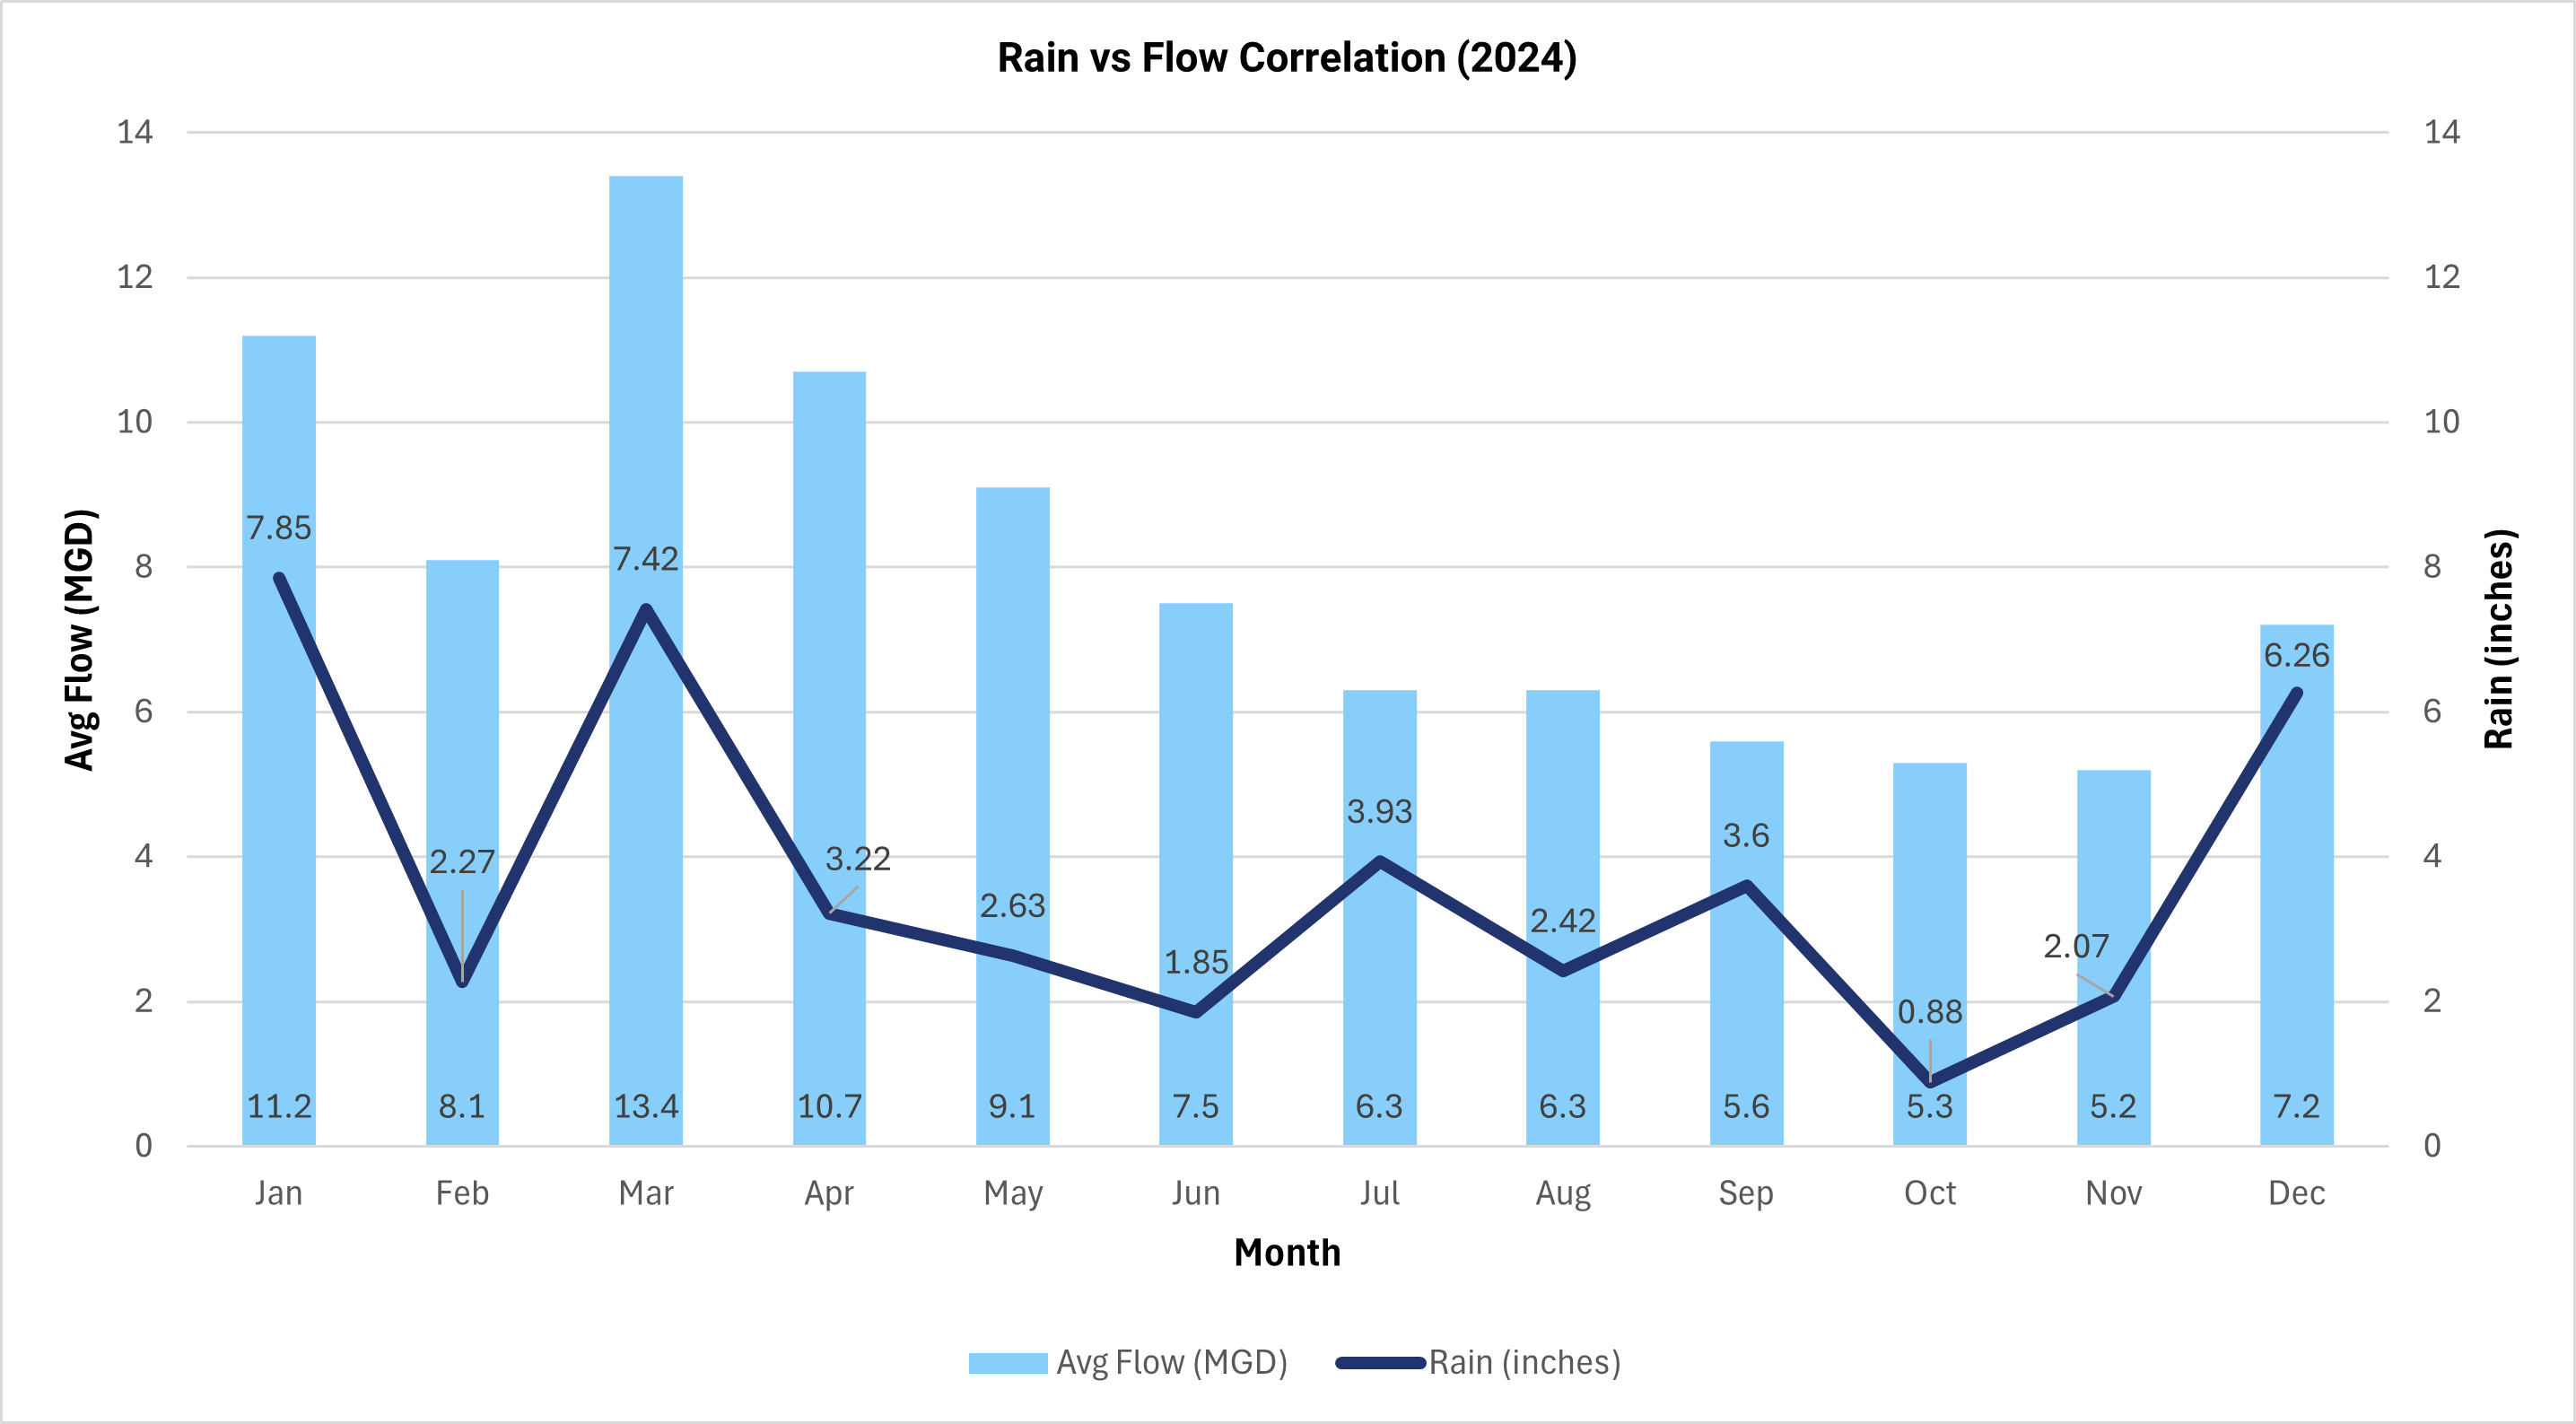
Heavy spring rains diluted incoming wastewater. The plant continued to operate within permit terms throughout the period.
Combined Sewer Overflow Activity (2024)
In 2024, only the Washington Street CSO Treatment Facility recorded discharge events. The Wellington Avenue CSO Treatment Facility had no discharge events during the year. All discharges were treated and disinfected before release in compliance with the City’s RIPDES permit.
| Date | Washington St. CSO (MG) | Wellington Ave. CSO (MG) | Remarks |
|---|---|---|---|
| Jan 10 | 3.82 | 0 | 2.22 inch rain; exceeded 1-yr/6-hr storm depth (permit exempt) |
| Feb | 0 | 0 | No activation |
| Mar 10 and 29 | 9.16 | 0 | Two events (1.08 inch and 1.75 inch rain); met limits |
| Apr 4 | 4.36 | 0 | Met bacteria and BOD limits; TSS removal 46.7 percent vs 50 percent permit minimum (reported to RIDEM) |
| May to Nov | 0 | 0 | No discharge |
| Dec 12 | 1.04 | 0 | Peak 15.38 MGD; TRC less than 0.1 mg/L; within limits |
Washington St. CSO: 3.82 MG
Wellington Ave. CSO: 0 MG
Remarks: 2.22 inch rain; exceeded 1-yr/6-hr storm depth (permit exempt)
Washington St. CSO: 0 MG
Wellington Ave. CSO: 0 MG
Remarks: No activation
Washington St. CSO: 9.16 MG
Wellington Ave. CSO: 0 MG
Remarks: Two events (1.08 inch and 1.75 inch rain); met limits
Washington St. CSO: 4.36 MG
Wellington Ave. CSO: 0 MG
Remarks: Met bacteria and BOD limits; TSS removal 46.7 percent vs 50 percent permit minimum (reported to RIDEM)
Washington St. CSO: 0 MG
Wellington Ave. CSO: 0 MG
Remarks: No discharge
Washington St. CSO: 1.04 MG
Wellington Ave. CSO: 0 MG
Remarks: Peak 15.38 MGD; TRC less than 0.1 mg/L; within limits
Biosolids and Flow Capacity
Effluent Quality Performance Charts
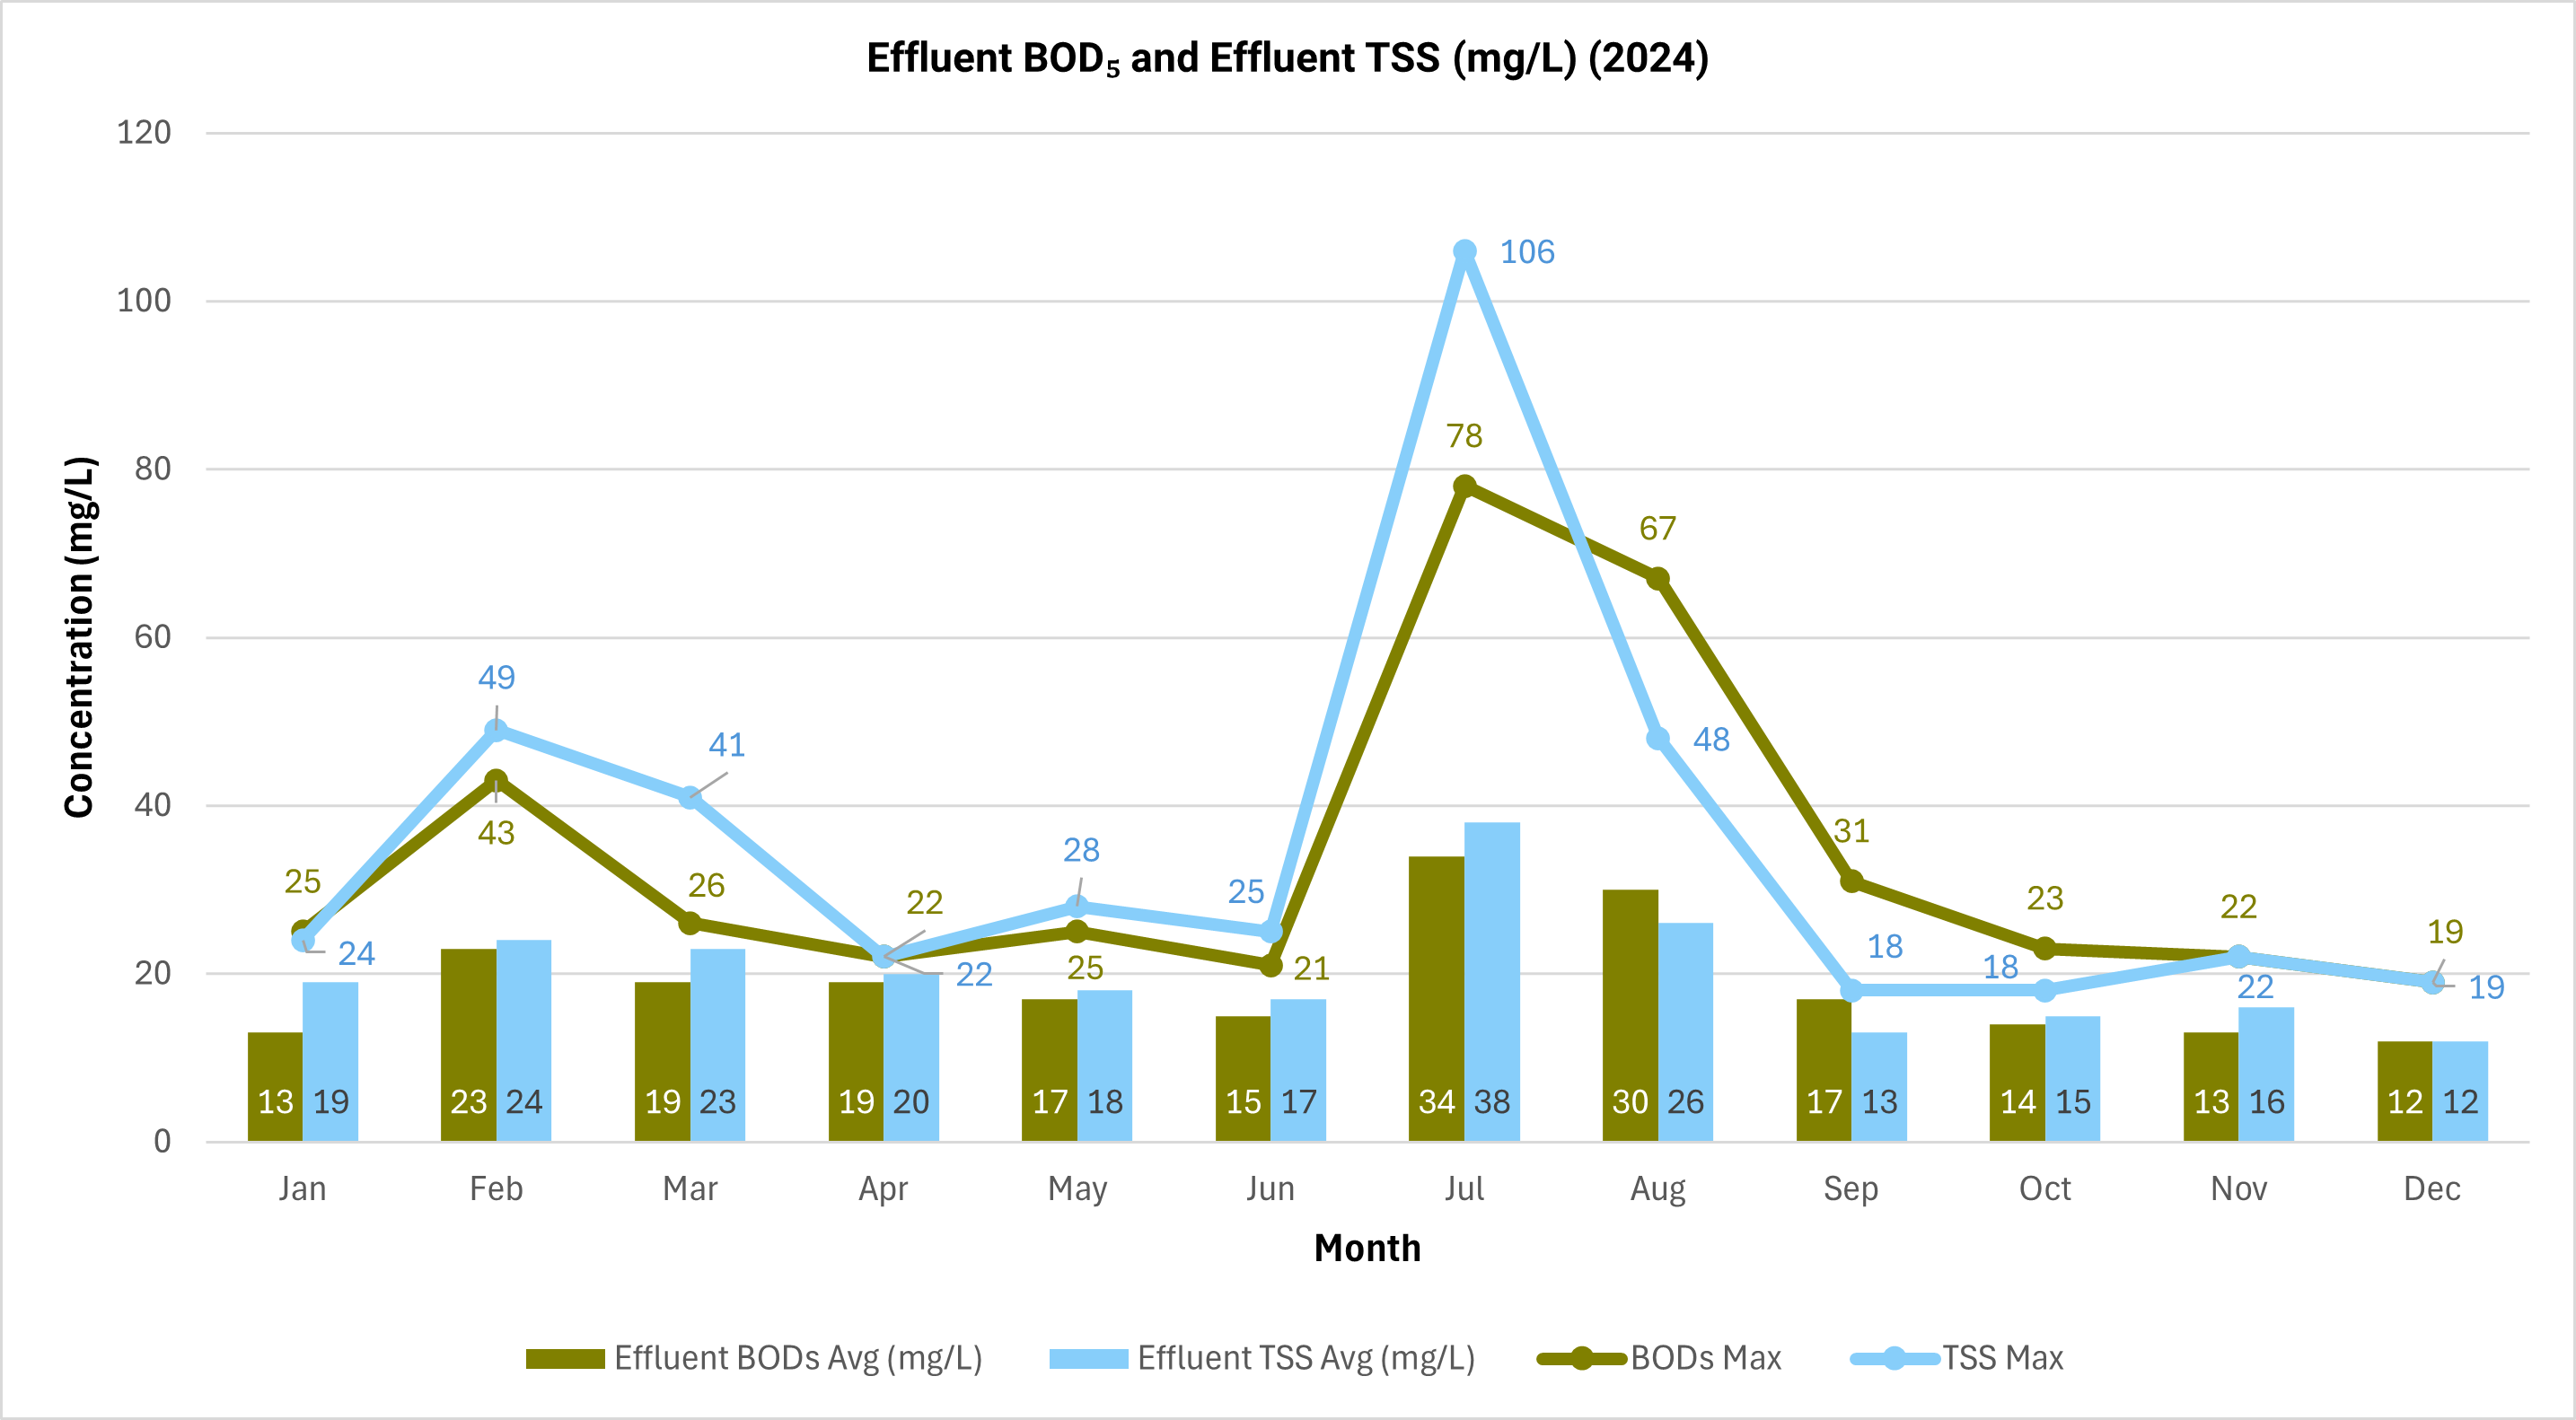
- BOD5 (mg/L): Five day Biochemical Oxygen Demand. Measures the amount of dissolved oxygen consumed by microorganisms in a water sample over five days at 20 degrees Celsius to break down organic matter. Indicator of biodegradable organic pollution in the water.
- TSS (mg/L): Total Suspended Solids. Measures the dry weight of solid particles (silt, clay, organic matter, algae) suspended in water that can be removed by a filter. High TSS can make water cloudy and harm aquatic life.
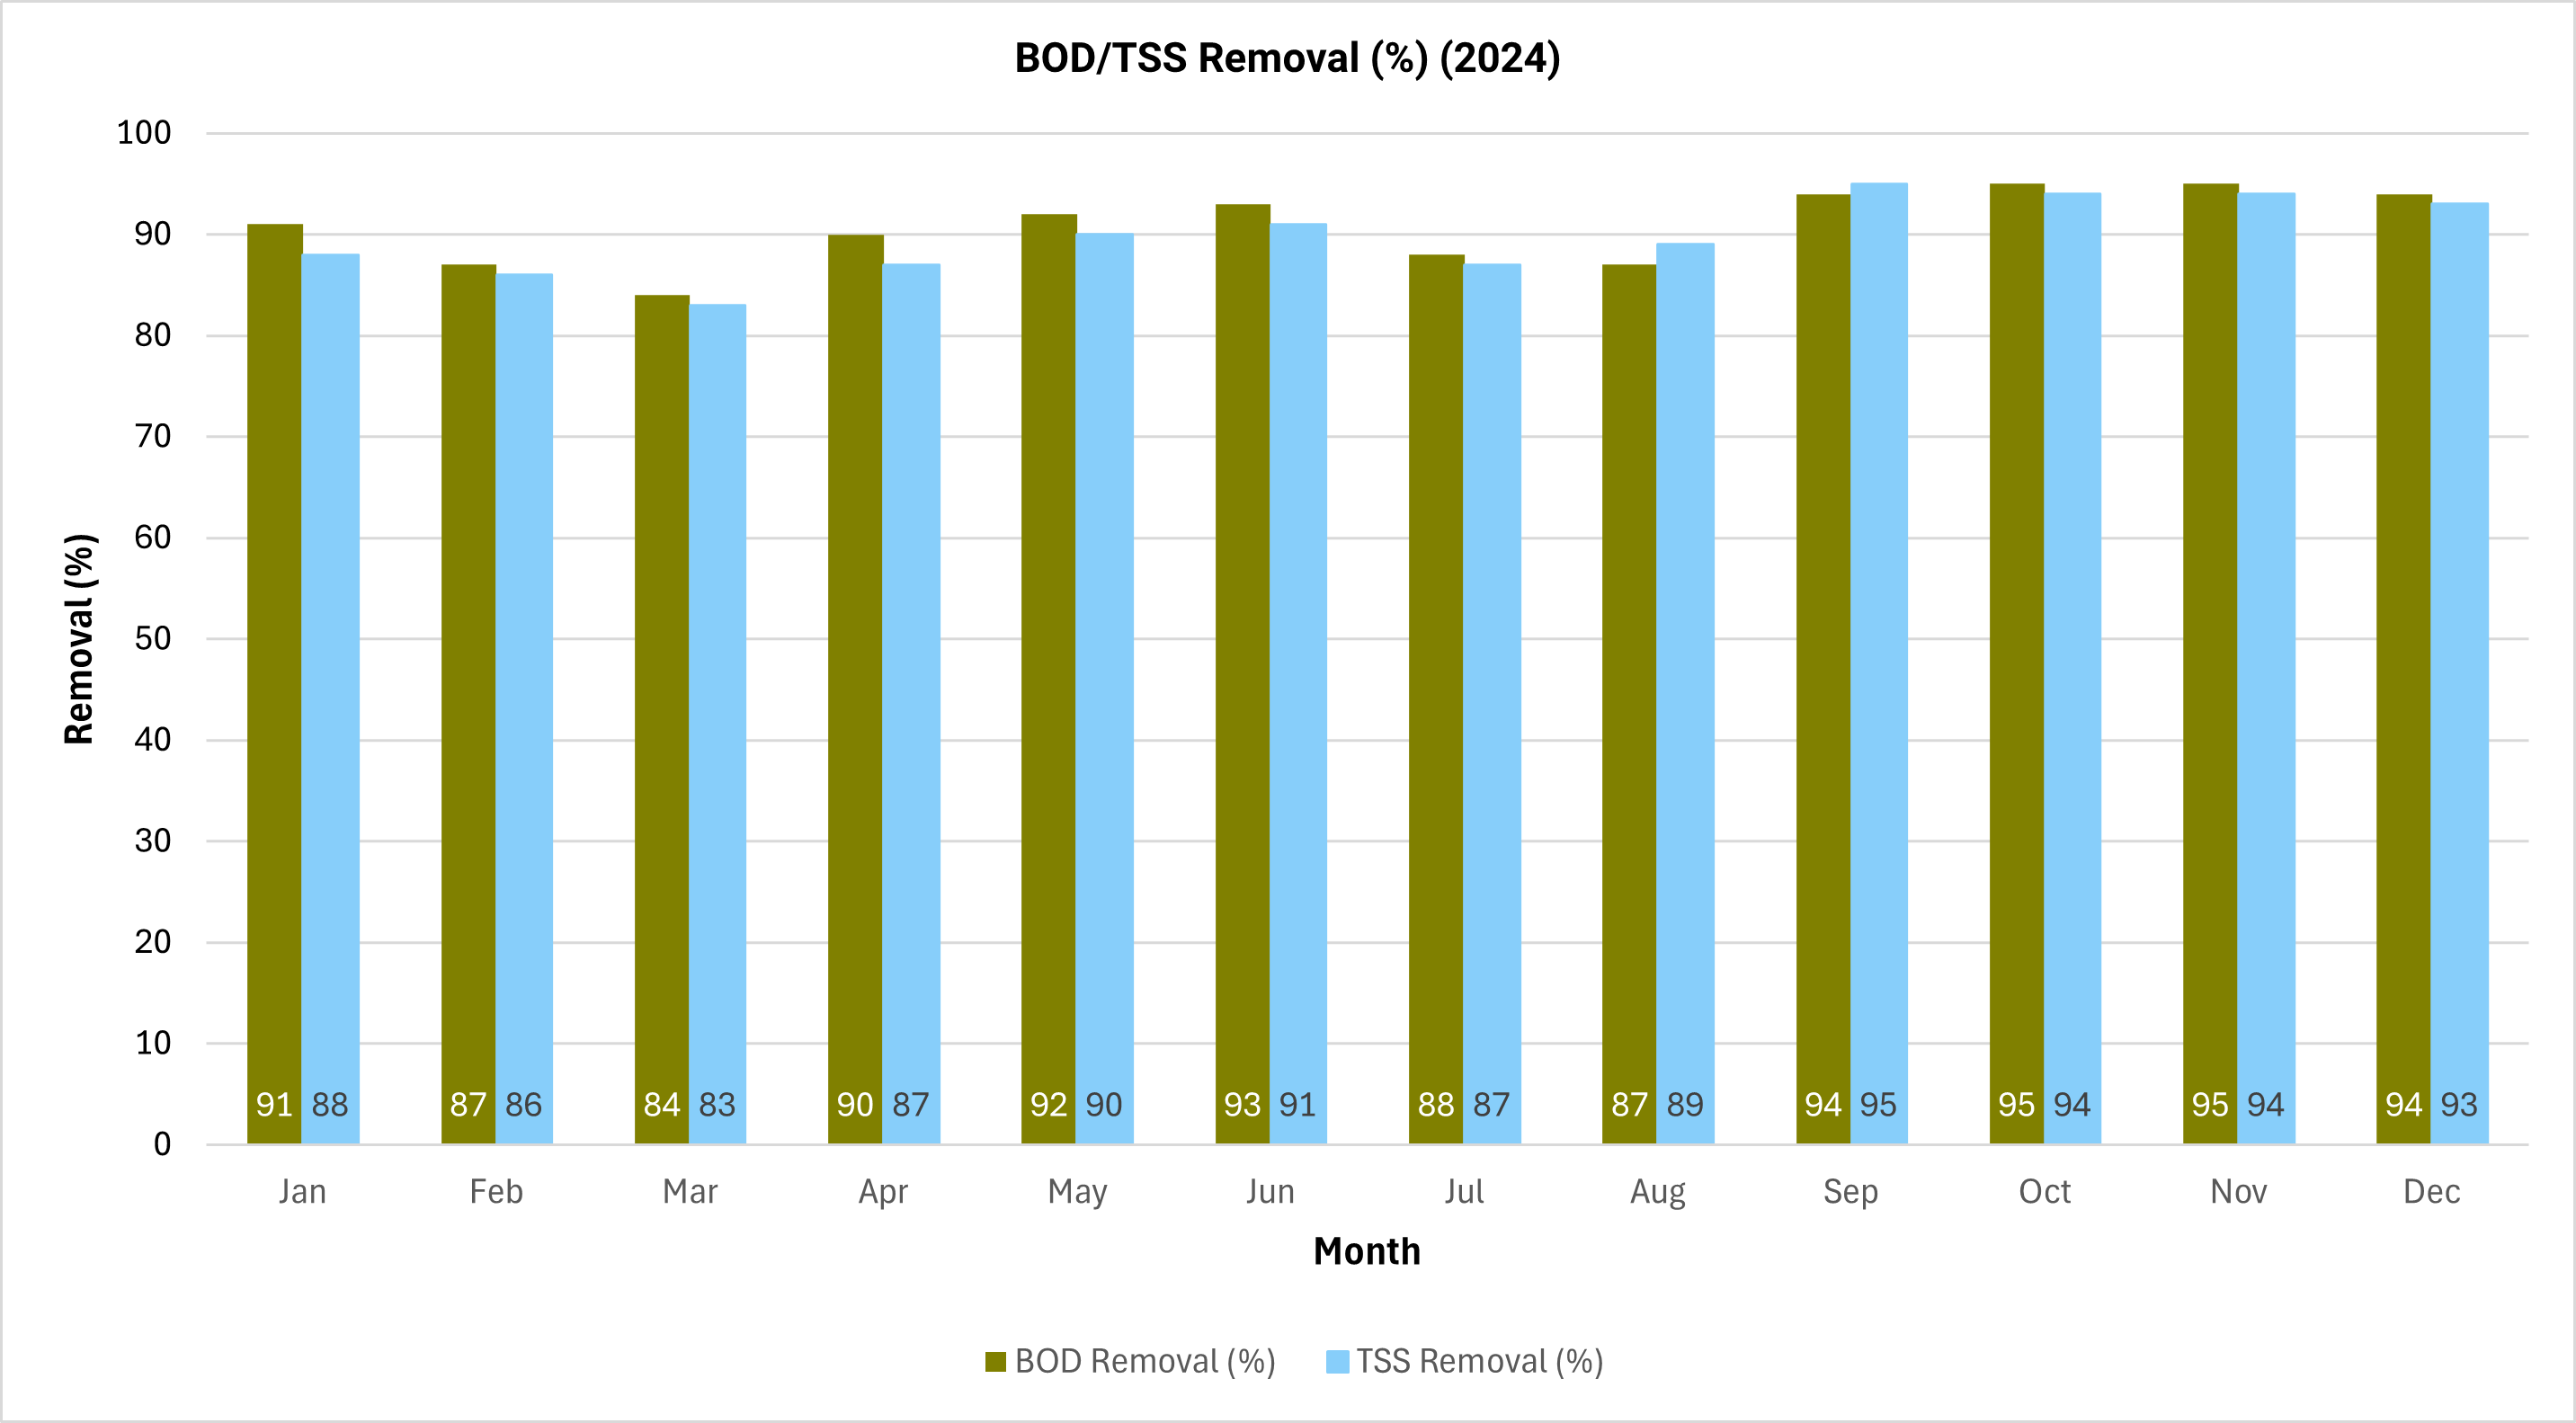
- Less than 75 percent indicates underperformance or a process issue. 80 to 85 percent is the minimum acceptable for compliance. 85 to 95 percent reflects typical healthy plant performance. Greater than 95 percent indicates highly efficient treatment or tertiary polishing.
- BOD/TSS Removal Efficiency (percent): Measure of how effectively the treatment process removes BOD or TSS pollutants. Calculated as: ((Influent Concentration minus Effluent Concentration) divided by Influent Concentration) times 100.
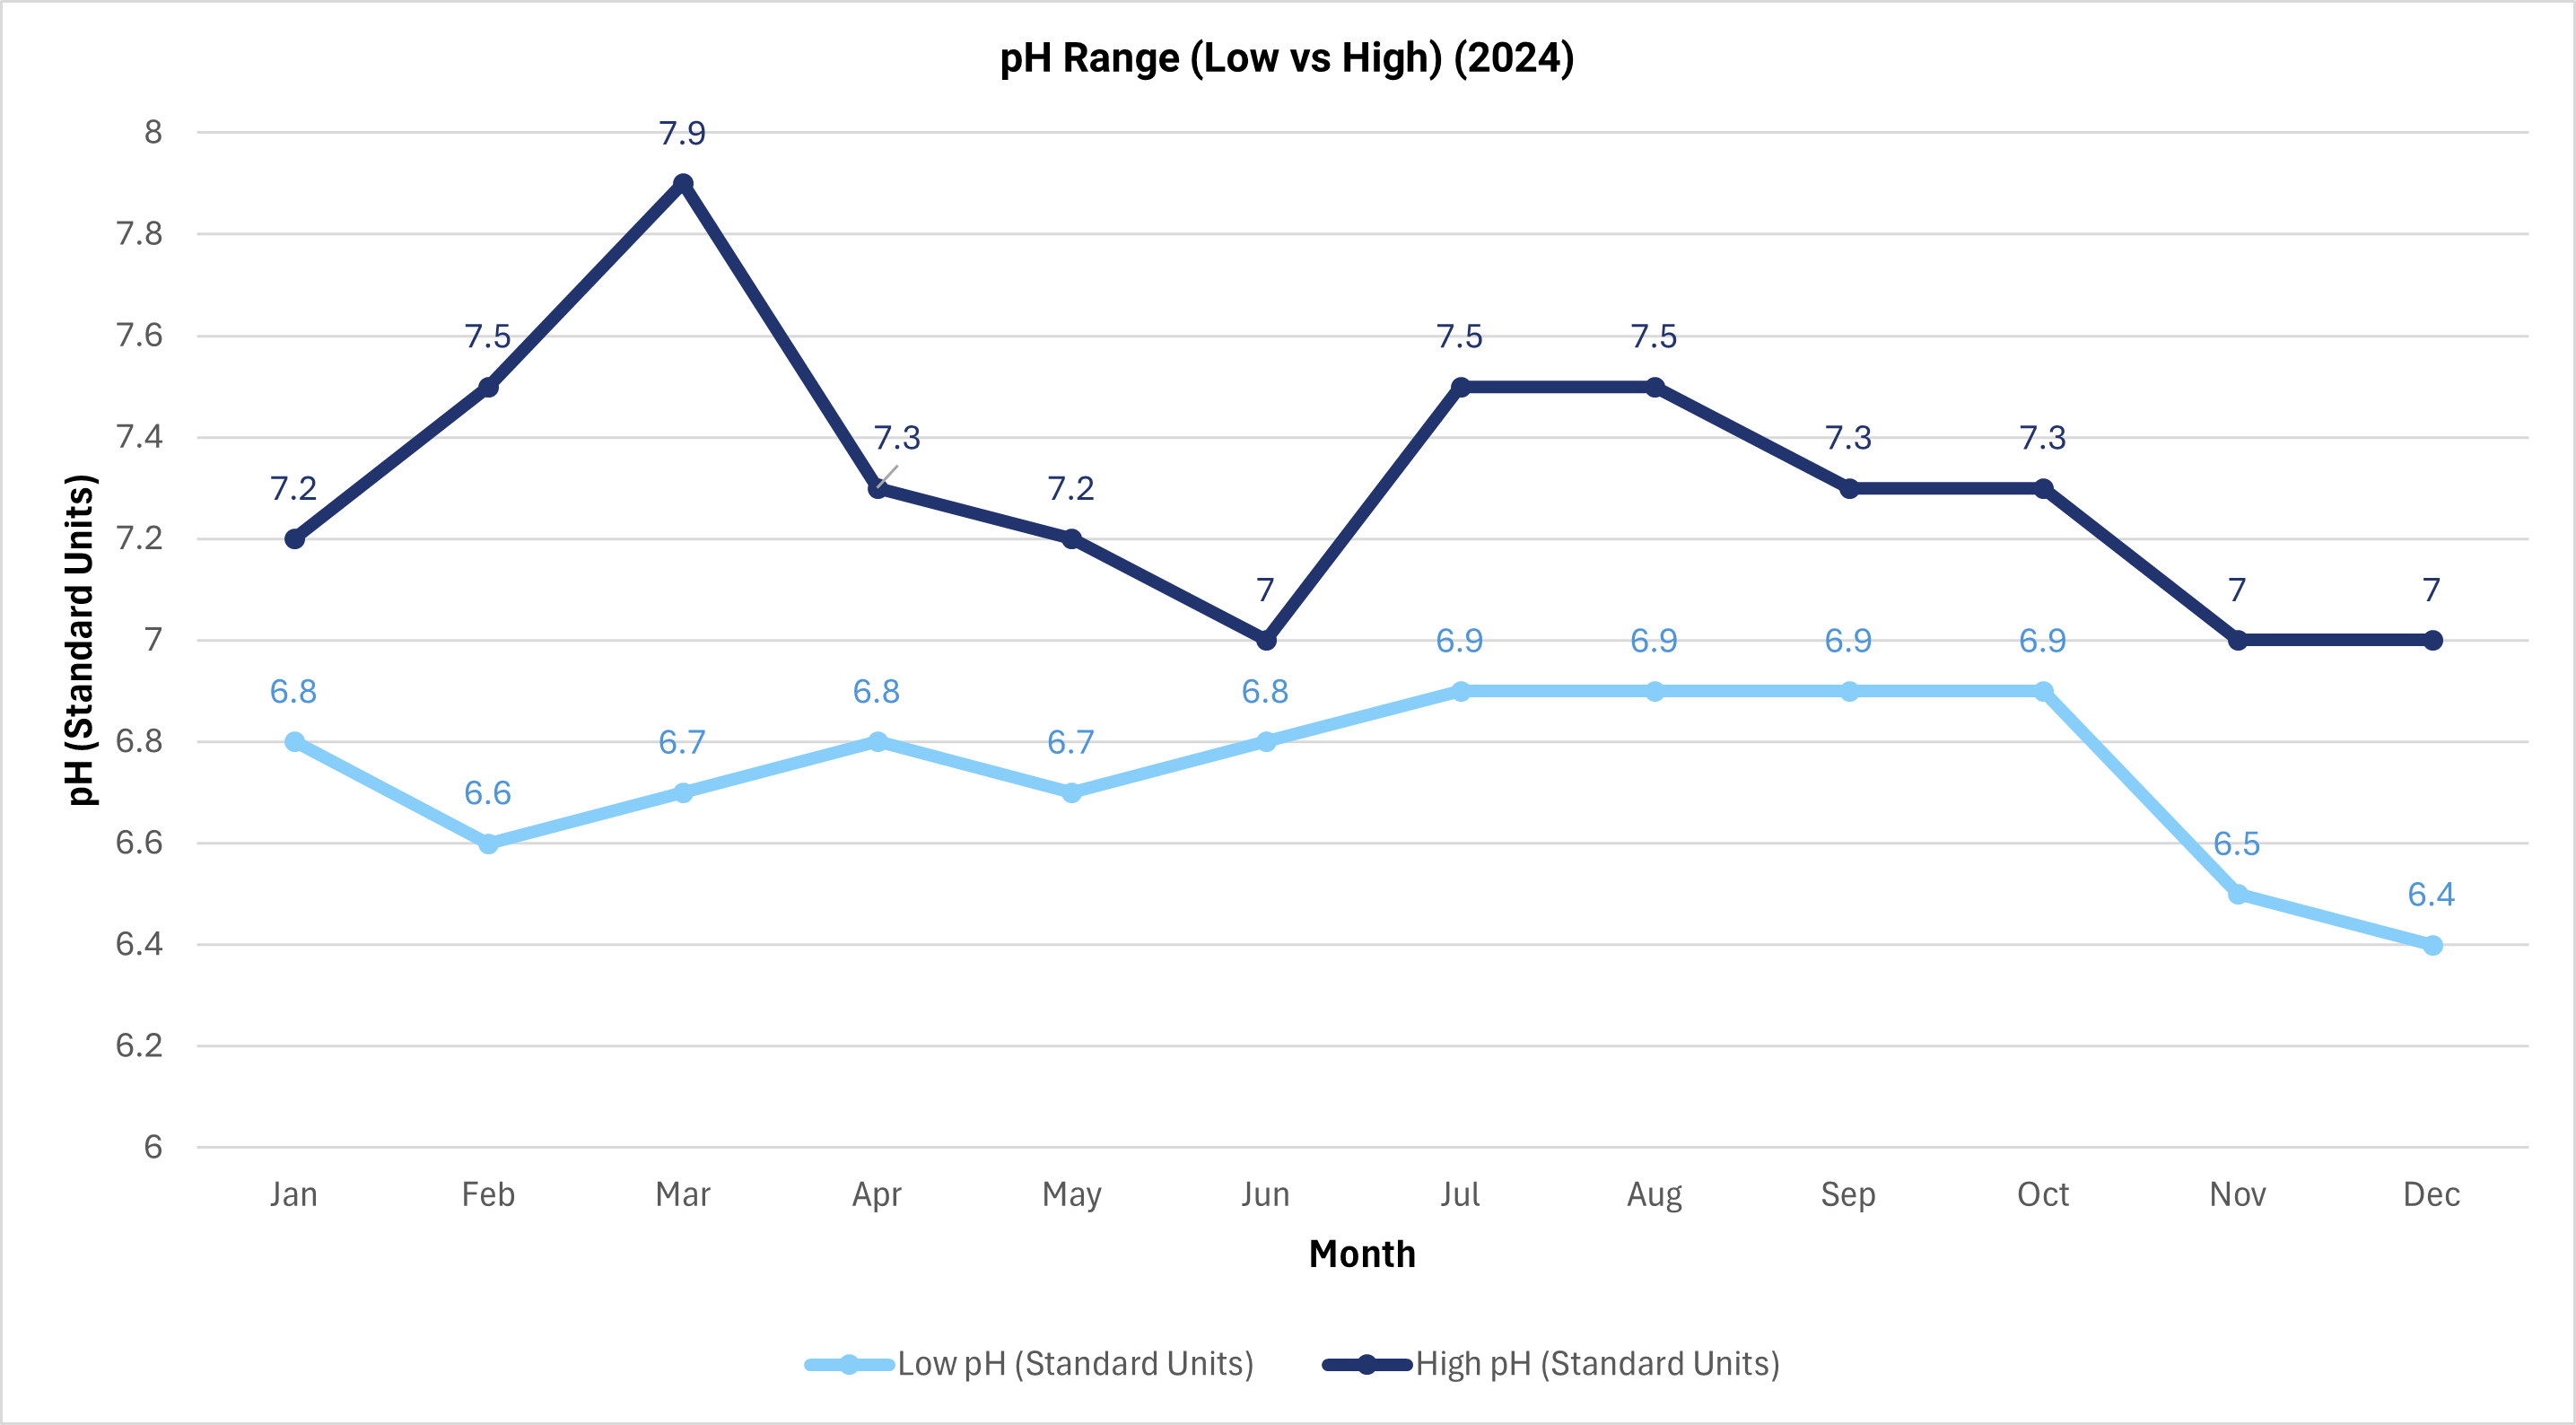
- pH Scale (0 to 14): 7 is neutral. Below 7 is acidic. Above 7 is basic or alkaline.
- pH (SU): Measure of how acidic or basic water is, reported in Standard Units (SU). The scale ranges from 0 to 14, with 7 being neutral.
Microbial Indicators
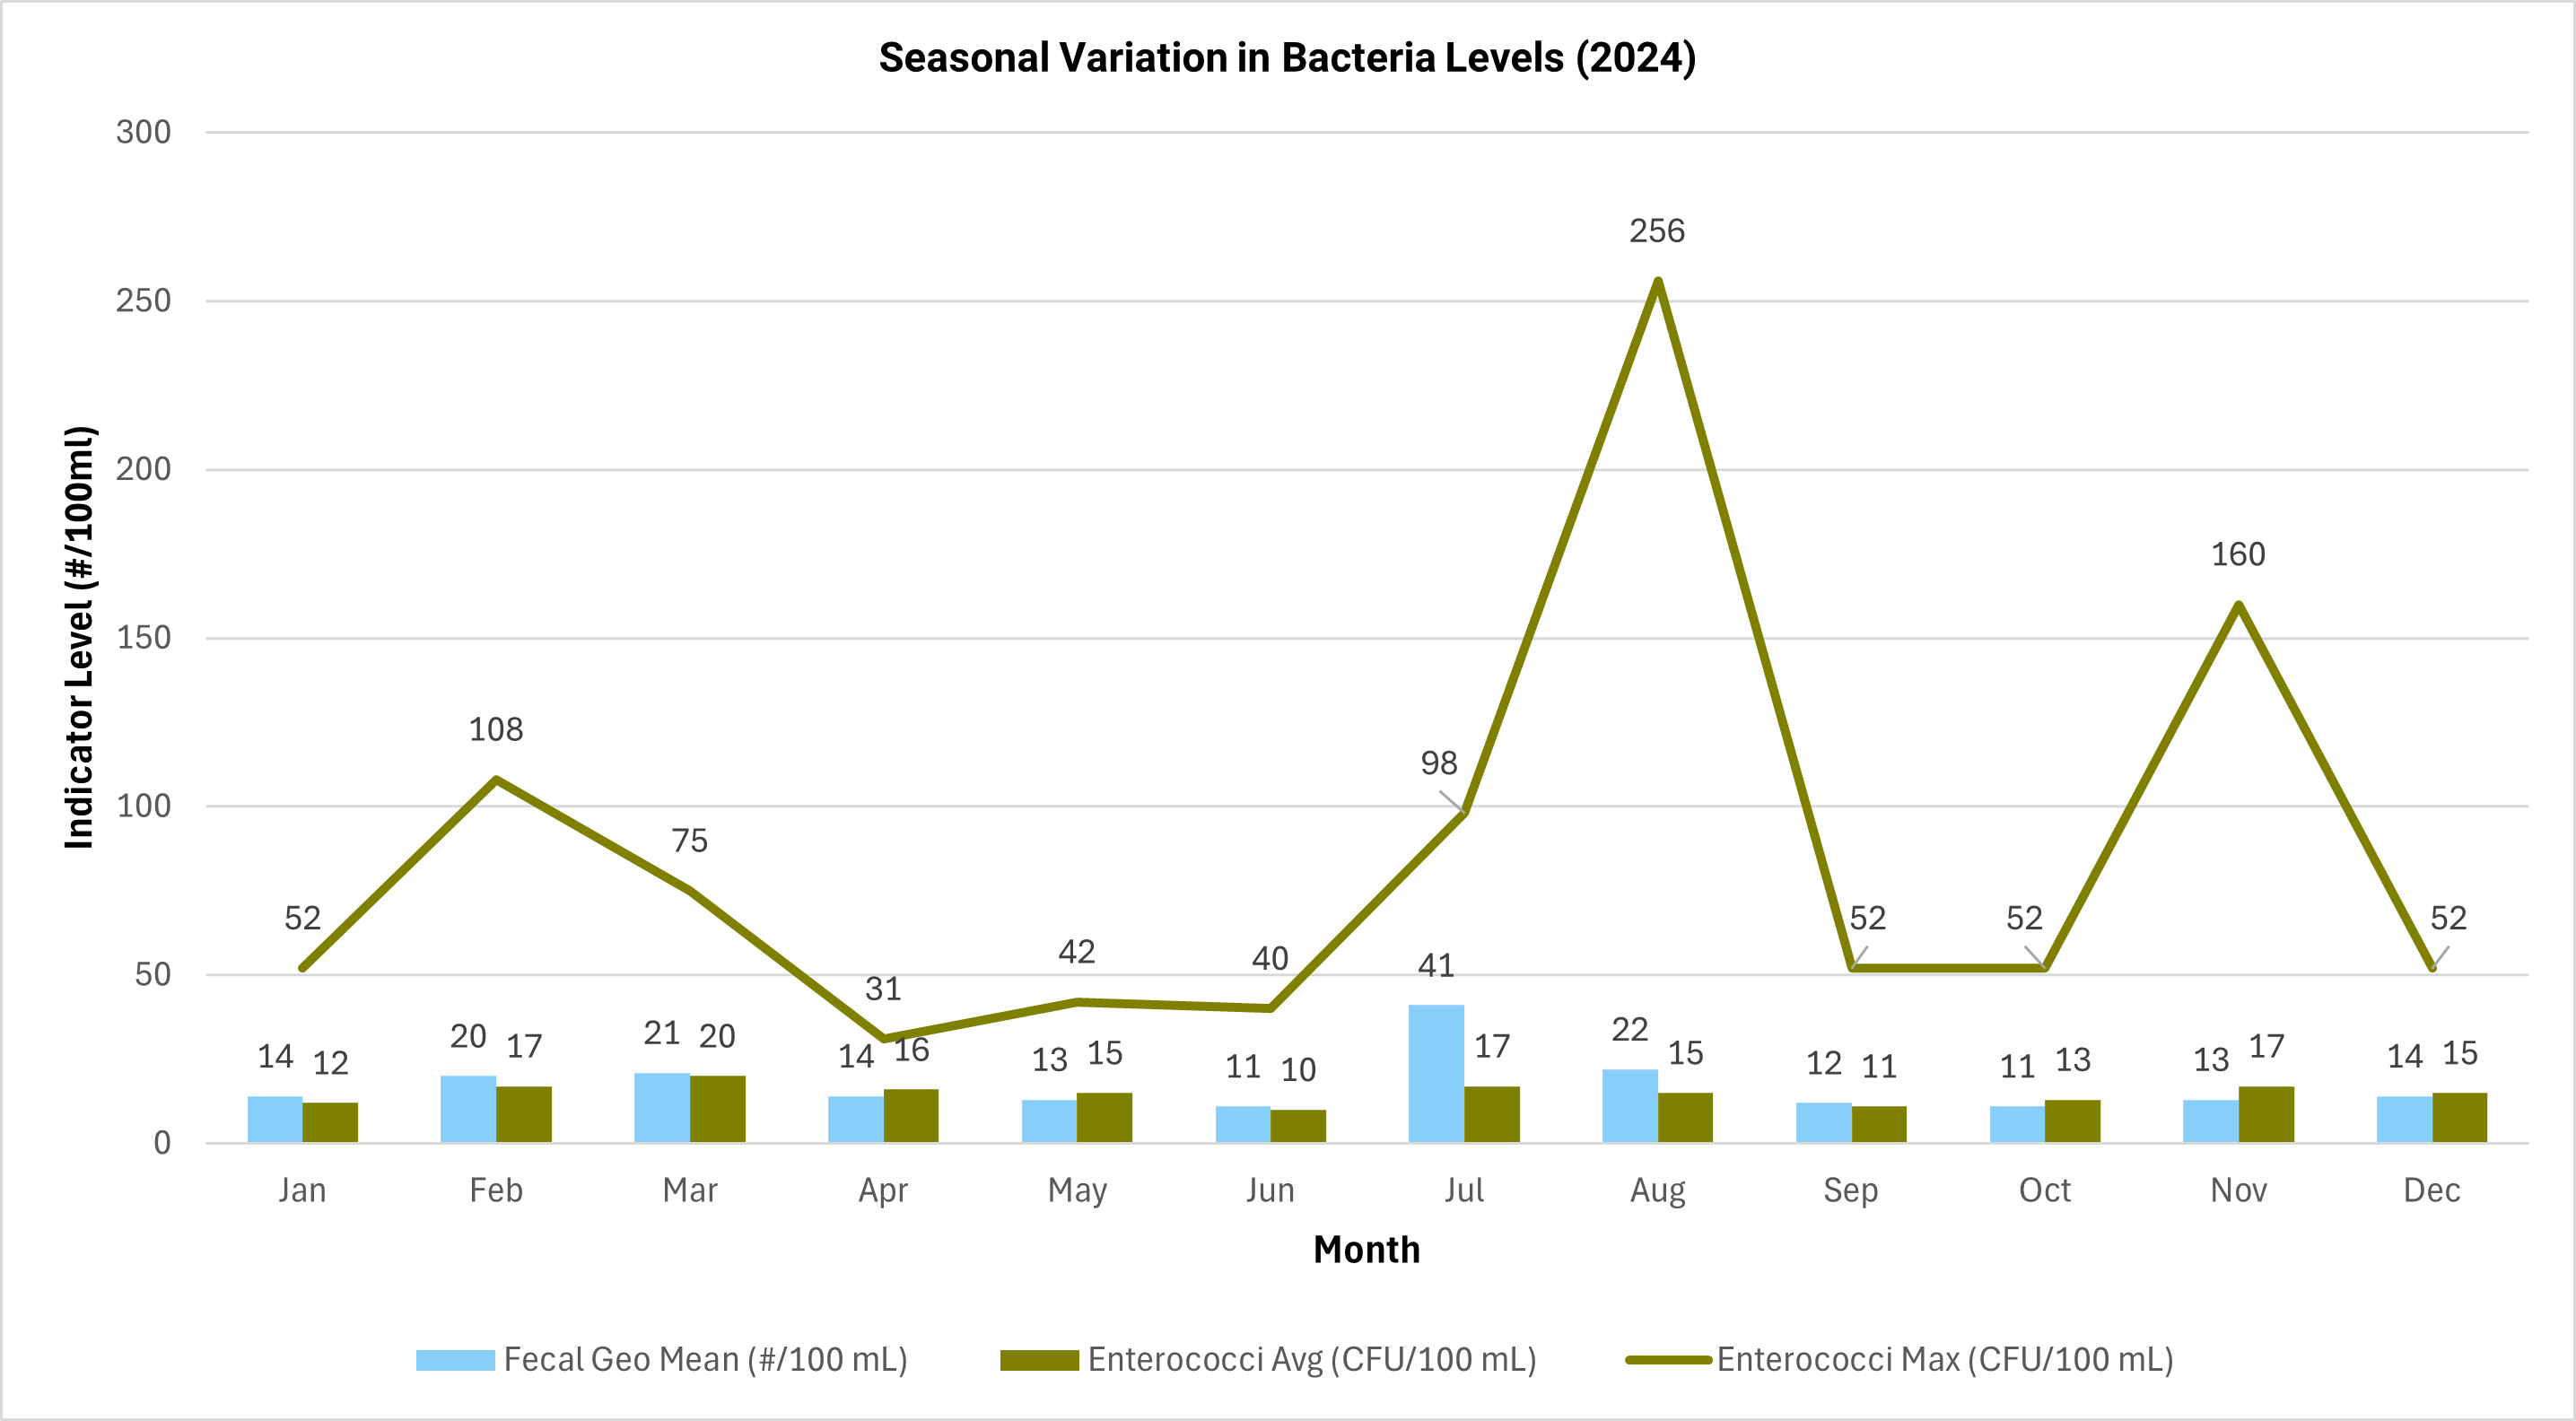
- Fecal Coliform and Enterococci (Geometric Mean number per 100 mL): Bacteria that indicate the potential presence of fecal contamination from humans or animals. Used as indicators of pathogens and public health risk. Concentration is expressed as a geometric mean of the number of colonies per 100 milliliters of water sample.
Environmental Factors
- Average Monthly Flow (MGD): The average volume of wastewater flowing through the treatment plant over a calendar month, measured in Million Gallons per Day. Used for managing system capacity and compliance with discharge limits.
Observed Trends and Corrective Actions
| Category | Details |
|---|---|
| Winter and Spring (high flows) | March and April rain events (greater than 7 inches each month) caused dilute influent and temporary TSS/BOD removal efficiency dips within permit terms. |
| Summer events | July clarifier seal failure and August sample analysis interference led to isolated daily exceedances. Equipment and protocol corrections completed within two weeks; events reported to RIDEM. |
| Fall and Winter recovery | September through December showed consistently high removal rates, low effluent solids, and consistent disinfection across all indicators. |
| Biosolids management | Synagro removed approximately 6,900 wet tons total; average cake solids approximately 22 percent (TKN approximately 25 mg/L, NH3-N approximately 20 mg/L). |
| Wet weather flow capacity | December 12 peak of 15.38 MGD handled within permit terms, confirming hydraulic capacity under storm conditions. |
Details: March and April rain events (greater than 7 inches each month) caused dilute influent and temporary TSS/BOD removal efficiency dips within permit terms.
Details: July clarifier seal failure and August sample analysis interference led to isolated daily exceedances. Equipment and protocol corrections completed within two weeks; events reported to RIDEM.
Details: September through December showed consistently high removal rates, low effluent solids, and consistent disinfection across all indicators.
Details: Synagro removed approximately 6,900 wet tons total; average cake solids approximately 22 percent (TKN approximately 25 mg/L, NH3-N approximately 20 mg/L).
Details: December 12 peak of 15.38 MGD handled within permit terms, confirming hydraulic capacity under storm conditions.
Annual Compliance Reports
Annual compliance reports and Discharge Monitoring Reports (DMRs) filed with RIDEM are available on request from the Department of Utilities. Email utilities@NewportRI.gov or call 401-845-5600 to request copies of monthly DMR submittals or annual compliance summaries.